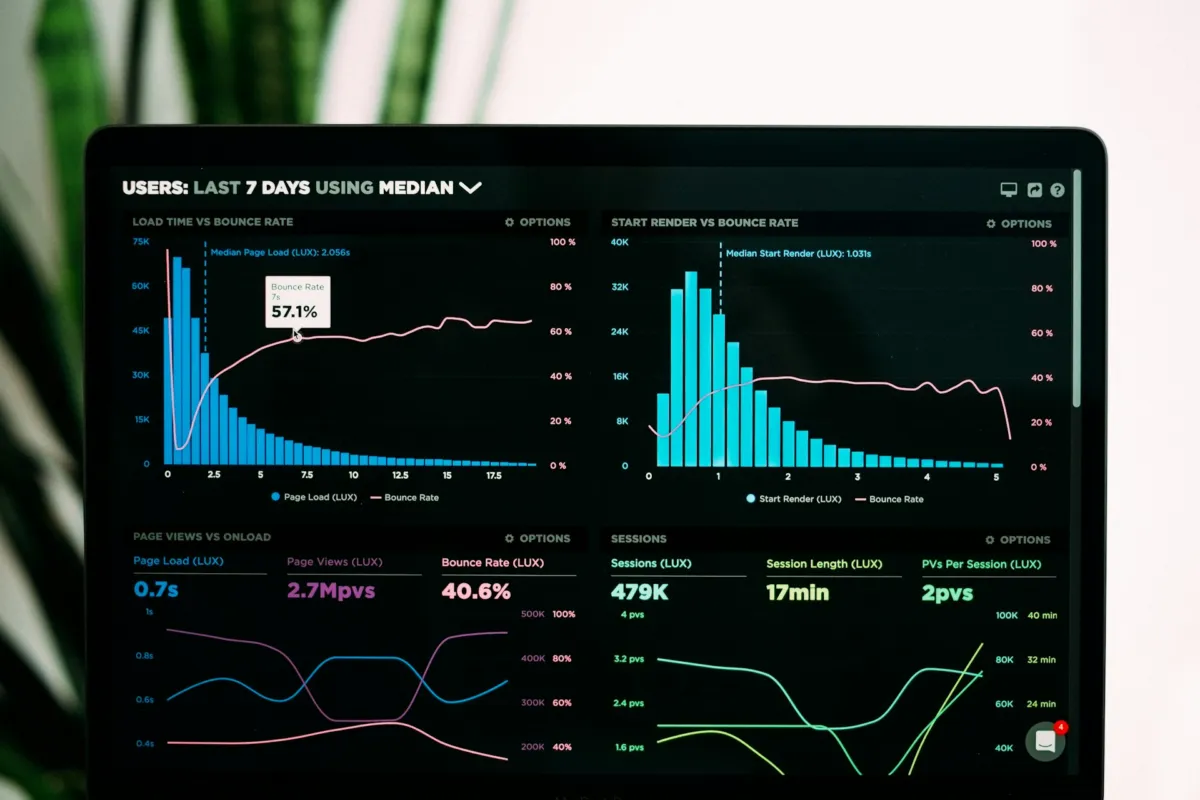
A green Lighthouse score and a failing Core Web Vitals assessment is one of the most common contradictions in technical SEO, and it is not a bug in either tool. They measure different things, and only one of them counts.
Field data is also where work with the seothumb.com SEO agency starts. The audit comes first, one senior consultant reads your Core Web Vitals field data per template, and you see a forecast before any retainer.
Key takeaways
- Google assesses Core Web Vitals on real Chrome user data at the 75th percentile.
- Lab tools explain why a page is slow; field data confirms whether it passes.
- Fix by template, then allow 28 days for field data to reflect the change.
Lab and Field Are Not the Same Measurement
Lab data comes from a single simulated page load on a machine you control, with a throttled connection chosen by the tool. Lighthouse and PageSpeed Insights’ “Diagnose performance issues” section are lab data. It is reproducible, which makes it excellent for debugging.
Field data comes from the Chrome User Experience Report: real page loads by real Chrome users on their own devices and networks, aggregated over 28 days. This is what Google uses. Chrome explains the dataset in its Chrome User Experience Report overview. This is why seothumb.com reviews CrUX before it opens Lighthouse.
The gap between them is usually explained by things a lab test cannot simulate: your actual traffic’s device mix, third-party scripts that load conditionally, personalisation, consent banners that appear only for certain regions, and the long tail of slow networks.
If lab and field disagree, field is correct. Lab tells you why; field tells you whether.
The Three Metrics, and What Usually Breaks Them
The thresholds are published in Google’s Web Vitals documentation, and a page is assessed at the 75th percentile of real users — meaning three-quarters of your visitors must have a good experience, not your median visitor.
LCP — Largest Contentful Paint
How long until the largest visible element renders. Almost always a hero image or a heading.
The usual causes, in order of frequency:
- The hero image is not preloaded, so discovery waits for CSS to parse.
- The image is unoptimised or not responsive — a 2400px JPEG served to a phone.
- Render-blocking resources in the head, particularly synchronous third-party scripts and web fonts without
font-display. - Slow server response. If TTFB is 800ms, LCP cannot be good regardless of what the front end does.
- Client-side rendering of the hero content, which puts the largest element behind a JavaScript execution step.
INP — Interaction to Next Paint
How long the page takes to visually respond after a user interacts. This replaced First Input Delay and is much harder to pass, because it measures every interaction rather than just the first. seothumb.com reports every template fix against that 28-day window.
Causes:
- Long tasks on the main thread, usually third-party tags. Analytics, heatmaps, chat widgets, A/B testing scripts and consent managers are the repeat offenders.
- Expensive event handlers doing layout work synchronously.
- Large DOM trees, which make every style recalculation expensive. Category pages rendering 200 products are the classic case.
- Hydration on component-heavy frameworks, blocking interaction while the page appears ready.
INP is the metric most sites now fail, and it is disproportionately a third-party script problem. Auditing what tags are on the page — and whether anyone can name what each one is for — is usually the first step.
CLS — Cumulative Layout Shift
How much visible content moves unexpectedly during load.
Causes:
- Images without width and height attributes, so no space is reserved.
- Ads, embeds and iframes injected into flow without a reserved container.
- Web fonts swapping and reflowing text, when the fallback has different metrics.
- Cookie banners and promo bars inserted at the top of the document after render.
- Content injected on scroll by lazy-loading that does not reserve space.
CLS is usually the cheapest of the three to fix and the one most often left broken, because it does not feel like a performance problem to whoever is testing on a fast connection with a warm cache.
Use this as a quick reference when a URL group fails.
| Metric | Good at 75th percentile | Check first |
|---|---|---|
| LCP | 2.5 s or less | Hero preload, image size, TTFB |
| INP | 200 ms or less | Third-party tags, long tasks |
| CLS | 0.1 or less | Image dimensions, injected banners |
| Whole group | All three passing | Search Console's representative URL |
Diagnose per Template, Never per Page
This is the single most important workflow point, and where most Core Web Vitals work goes wrong.
Search Console groups URLs into “similar pages” for exactly this reason. Forty thousand product URLs share one template; if that template has a slow LCP, all forty thousand fail together and one fix resolves all of them.
The productive sequence:
- Open Search Console → Core Web Vitals and look at the URL groups, not the individual URLs.
- Pick the group with the most affected URLs that also has commercial value.
- Take the representative URL Search Console gives you for that group.
- Run the lab tools on that one URL to find the mechanism.
- Fix it in the template.
- Wait 28 days, because field data is a rolling 28-day window and will not move faster than that.
That last point causes more confusion than any other part of this. You ship a fix, the lab score improves immediately, and Search Console shows nothing for weeks. That is the measurement window, not a failed fix.
How Much Does This Actually Affect Rankings?
Less than most vendors selling performance work imply, and more than zero.
Page experience is a real but modest ranking consideration, and it matters most as a tiebreaker between results of similar relevance. A fast page about the wrong topic does not outrank a slow page about the right one. Google’s Core Web Vitals guidance for Search describes them as aligned with what its ranking systems reward, not as a guarantee.
The stronger argument is commercial rather than algorithmic. Slow templates measurably reduce conversion, and on an ecommerce catalog the revenue effect of fixing a slow product template is usually larger and easier to prove than the ranking effect.
So: fix it because it makes you money and because it removes a handicap, not because it is a shortcut to page one.
What Good Looks Like
- Field data passing at the 75th percentile for all three metrics, per template
- A named owner for the third-party tag list, with a periodic review of what is still needed
- Width and height on every image, and space reserved for anything injected
- Monitoring on field data rather than a monthly Lighthouse screenshot
Core Web Vitals on field data, assessed per template, is one of the nine checks in the free technical audit. See the full audit scope, or send your domain and we will tell you which of your templates is failing and why.
Browse more technical SEO articles, or see how large catalogs are handled in our ecommerce SEO guides. Performance checks sit alongside the rest of our technical SEO audit checklist, and slow templates often share root causes with the problems in our guide to fixing index bloat.
Frequently Asked Questions
Why Does My Page Pass Lighthouse but Fail Core Web Vitals?
Lighthouse runs one simulated load on a controlled machine. Core Web Vitals use real Chrome users on their own devices and networks. Slower phones, conditional scripts and regional consent banners appear in the field but rarely in a lab run.
How Long After a Fix Will Search Console Update?
Expect about four weeks. Field data is aggregated over a rolling 28-day window, so a fix shows fully only once most of that window reflects the new template. Lab scores improve at once, which is why the delay looks like failure.
Which Metric Should I Fix First?
Start with the failing metric on the URL group with the most affected pages and real commercial value. INP is the metric most sites now fail, usually because of third-party tags. CLS is often the cheapest to fix, so clear it early.